Everything you need.
Nothing you don't.
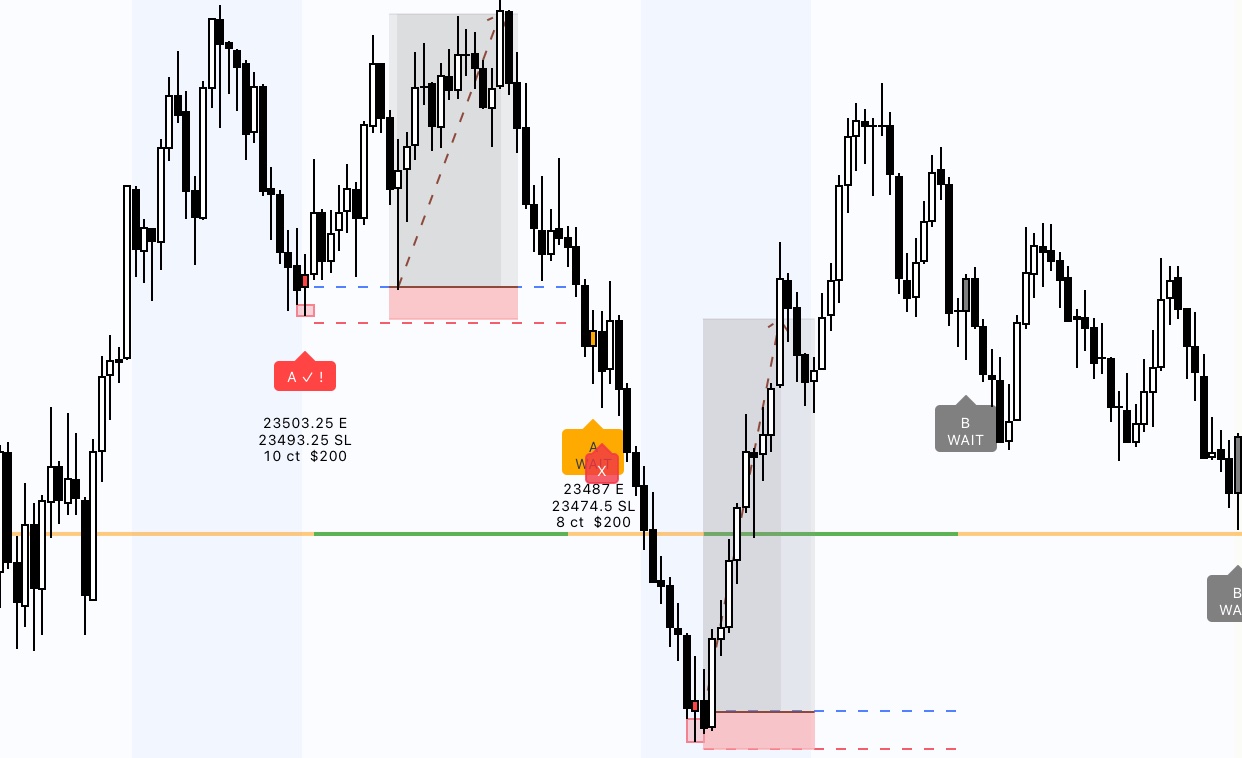
WAIT then ✓.
Two-stage pattern confirmation display.
When the software detects a qualifying pattern, it displays a WAIT label — a second candle must close above the pattern low before any visual reference zones appear. No action is implied at any stage.
If the candle closes below the pattern low, a red X appears — the pattern is visually marked as structurally invalid. The user observes and decides independently.
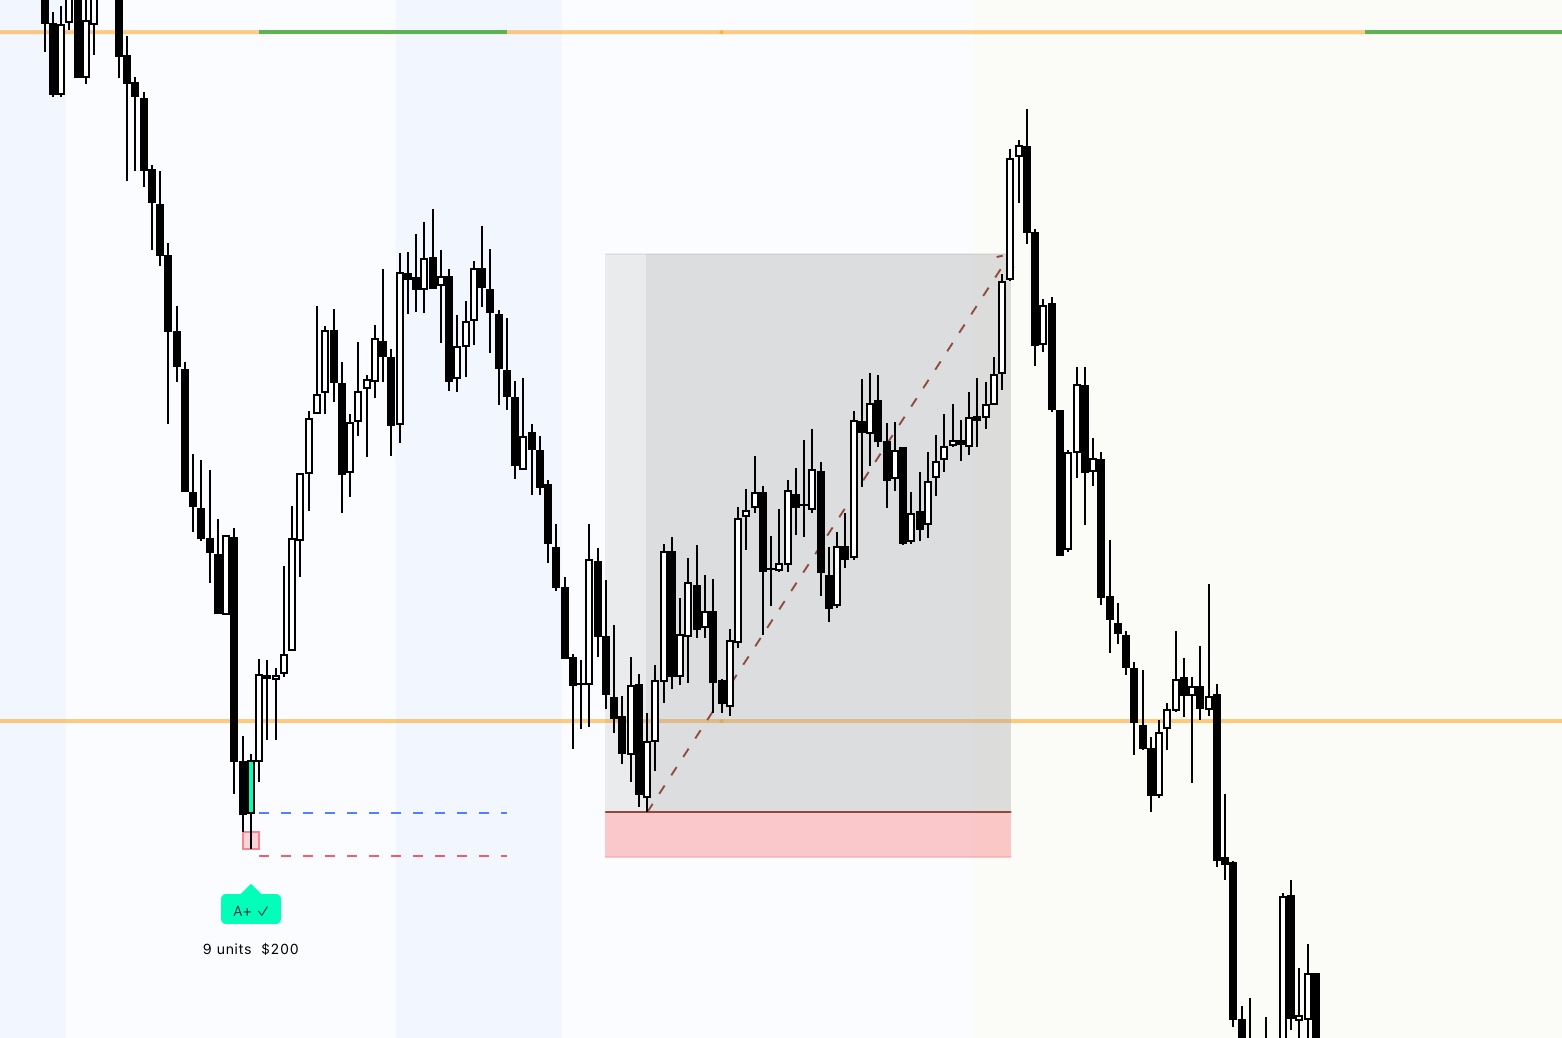
Visual Reaction Zone — Around the RB Pattern Area
The software highlights a visual reaction zone around the rejection candle — the price area where the prior structural rejection occurred. This is a visual reference only. No price level is recommended, no action is instructed. All decisions are made solely by the user.
Visual pattern display. Independent user decisions.
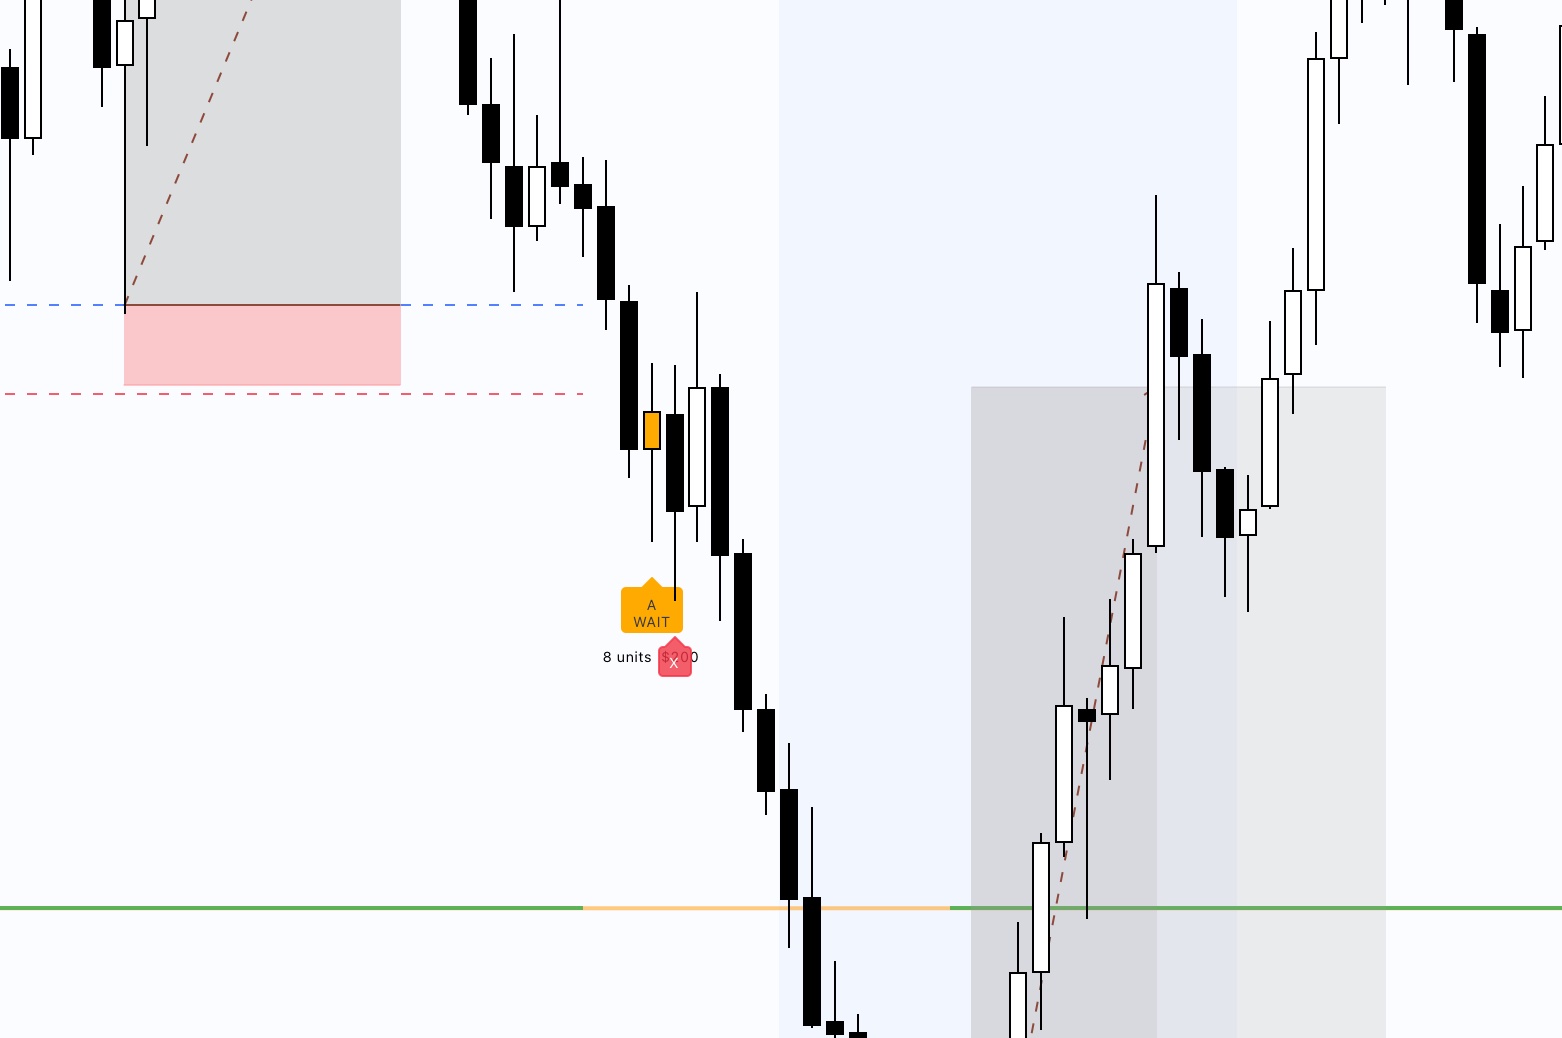
Unswept Zone Highlight.
Contextual awareness built in.
The tool checks whether unswept price zones exist below the current pattern area — using real candle wicks, not line chart data. When detected, the pattern label visually turns red to indicate reduced structural clarity.
Observationally, lower-clarity patterns often appear when the market has not yet reached a prior liquidity zone — the sweep of that zone may precede more significant reaction behavior. The tool surfaces this context visually.
Structural context. Independent observation.
Contracts = round($200 / $105) = 3 ct
Reference Size Display.
For any account.
Set your dollar risk once — the indicator automatically calculates how many contracts to take based on the SL distance of each individual setup.
Your limit order sits at the open of the rejection candle, so every entry is pre-calculated before price even retests. You know your contracts, your stop and the reference zone before the fill.
MNQ, NQ, MES, ES or custom. Never manually calculate again while the market is moving.
MNQ $0.50/tick · NQ $5.00/tick · Custom
Fully customizable.
Your setup. Your rules.
Time windows, session colors, execution lines, SL buffer, sweep box, premarket lines, LQ sensitivity, asset selection, alert texts — all adjustable directly in TradingView.
Whether 1-minute or 2-minute charts, NY Open or Macro window — the indicator adapts to you. No coding required.
Fully configurable without any coding knowledge.